Hacking Your Gems for Debugging

In an excellent post on Codenoble, Adam Crownoble explains [What To Do When You’re Stuck In Ruby][codenoble]. It was validating to read about someone else using a lot of the same tricks for digging in to software libraries. It also inspired me to share some tricks that I use frequently.

In one portion of the article, Adam mentions that you may encounter the need to hack up one of your local gems in order to gain a better understanding of what’s going on. The method prescribed is to clone the gem, make your alterations, then install from a git path using Bundler. This is a great method if you need to share your hacked up version of the gem with other developers, but it’s a bit heavy for quick & dirty debugging. I use the following technique to make direct edits to my gems, then revert back to a pristine install.

The workflow I use looks something like this:

1. Encounter a confusing outcome related to a gem.
1. Open the gem for editing and dig around to get oriented: `bundle open [GEM]`
1. Make alterations, run my application, iterate, resolve.
1. Run `bundle exec gem pristine [GEM]` to revert the gem back to its unaltered state.

Occassionally I’ll use the following at a shell prompt to probe around the gem files without opening the entire directory in my editor.

$ open $(bundle show rails)

This opens the gem directory in Finder under OS X.

Below is an overview of the available commands that support this workflow. Using these commands, you can use this workflow regardless of whether you’re using Bundler or bare Rubygems.

If you’re using bundler:

`bundle open [GEM]` – Opens the Gem’s base install dir in your editor.
`bundle show [GEM]` – Outputs the Gem’s base install dir.
`bundle exec gem pristine [GEM]` – Reinstalls the Gem to its unaltered state.

Interestingly, there is a [long-open Bundler feature request][bundlepristinefeature] for a `bundle pristine [GEM]` command that would eliminate the `bundle exec` call required to revert the gem while using Bundler.

If you’re using bare Rubygems:

`gem open [GEM]` – Opens the gem’s base install dir in your editor.
`gem which [GEM]` – Outputs the location of a gem’s primary library file.
`gem pristine [GEM]` – Reinstalls the gem to its unaltered state.

When using the `open` variant of these commands, Rubygems/Bundler will use the editor configured in your environment.

[Rubygems][rubygemsopen] looks at: `GEM_EDITOR`, `VISUAL`, `EDITOR`, and finally reverts to `vi` if none of these are configured.

[Bundler][bundleropen] looks here: `BUNDLER_EDITOR`, `VISUAL`, `EDITOR`, and will complain if none are set.

I only set `VISUAL` and `EDITOR` because most software packages respect these two. Only use the RubyGems and Bundler specific environment variables if you want to use an editor that isn’t consistent with your normal preferences.

If you’re a polyglot, and you’re looking for something that helps you achieve similar goals with a variety of languages, have a look at the [Qwandry gem][qwandry], which allows you to open Python, Perl, Node, and Rubygems (maybe more) libraries in similar fashion to Rubygems and Bundler. You’re on your own for reverting edits though.

[codenoble]: http://codenoble.com/blog/what-to-do-when-youre-stuck-in-ruby/

[rubygemsopen]: https://github.com/rubygems/rubygems/blob/c6b4946f84a1a291a9c6f072bcc2832617f33888/lib/rubygems/commands/open_command.rb

[bundleropen]:https://github.com/bundler/bundler/blob/7be4f29c7caaccead7a6d9014839a8b3a63da315/lib/bundler/cli/open.rb

[bundlepristinefeature]:https://github.com/bundler/bundler-features/issues/5

[qwandry]: https://github.com/adamsanderson/qwandry

Misunderstanding Minecraft

From a recent BBC article titled [Minecraft videos – why are they so addictive?](http://www.bbc.com/news/technology-32736808):

> The game, said the researchers, becomes “less about open-ended play and more about working to complete the never-ending stacks of buildings.”

Spoken like someone who hasn’t spent much time with kids playing Minecraft. I’ve run a MC server for my niece since January of 2014. There are around 15 of her friends who play regularly on the server. “Never-ending stacks of buildings,” would bore them to tears.

In addition to stacking blocks, Minecraft has:

* Redstone: A set of blocks and items that can be used to create (electrical-like) circuits.
* Server Commands: A complex set of commands that can be used to manipulate the environment, spawn creatures, and move the player around.
* Command Blocks: Special blocks that can have commands stored in them, and are triggered by Redstone.

The Minecraft server I run also supports something called mods, which extend the standard functionality of the game, and in the case of my server, allow the kids to create multiple worlds within which they can transport themselves and create different types of play environments.

There are two world types that go far beyond stacks of blocks. The simpler of the two are arenas. They’ve built an arena with a community-established set of gameplay rules. You can compete alone or as a team. The arena master controls the spawning of enemies and the difficulty of the game.

It is fascinating to watch a new arena master learn how to balance difficulty. Make the arena too hard and no one wants you to be arena master (a job that is appointed in impromptu elections). Make it too easy, and everyone gets bored and moves on to other areas of the game. There are complex social dynamics at play. As the sole adult on the server, I’ve spent plenty of time counseling 7 to 12 year olds on the subtleties of *not* abusing your friends when the opportunity presents itself. They learn quickly.

The most advanced world type, and the one that really blows my mind, are the “adventure” worlds. They combine structures they build with command blocks to create interactive adventures. You press a button and you’re transported to the inside of a cottage. From there, a stream of messages orient you, and you’re tasked with some objective: solve a puzzle to escape the house, locate an item hidden near by, find tools to fight off an incoming wave of zombies, survive long enough to reach a far away destination. The possibilities are endless, and the kids exhaust them all.

Minecraft is so open-ended that the types of play are no more bounded by the game than outdoors play is bounded by the laws of physics. My advice for parents would be to spend some time learning about what is possible and guide your children in the direction of activities that go beyond the mundane. Talk to them about the social dynamics they encounter online. You may be surprised at how complex it all becomes.

Curse you, Apple, for breaking the fonts panel

This is the new “Fonts” panel (available by pressing ⌘T in most text fields) in Yosemite.

font-panel-yosemite

This is the same panel in Mavericks, which has relatively consistent for the last few revisions of the OS:

font-panel-mavericks

See the text field under the “Family” column? That used to filter the font list in real time as you typed in to that field. That feature is gone under Yosemite, leaving me with two choices for changing fonts:

1. Scroll through my (admittedly) ridiculously long list of fonts to find what I need.
2. Click in the field and start typing.

The former is a horrible manual operation that involves scanning through the font list by eye. This is exactly the kind of thing computers are good at. I tell the computer what I’m looking for, and it filters information so my slow, wet meat brain has an easier time of finding what it wants.

The latter works… sometimes. The problem is, the behavior of the Fonts panel is broken, even in some of Apple’s own applications. To see this in action:

1. Open Mail.app and compose a new email.
2. Type something in the body of the email.
3. Select some (or all) text.
4. Press ⌘T.
5. Click in the “Family” list.

At this point, you will note that the Fonts panel refuses to receive focus. This prevents you from typing to select your font. The same problem exists in TextEdit, OS X’s bundled, basic word processor/text editor.

I frequently send emails with snippets of source code in them. This means that I need a [monospaced font](http://en.wikipedia.org/wiki/Monospaced_font) to preserve alignment and indentation. This process is now a horrible pain in my ass every time I need to do it.

I guess you could say that I’m jumping on the “[Apple has lost the functional high ground](http://www.marco.org/2015/01/04/apple-lost-functional-high-ground)” bandwagon, but I think it’s important to write about these problems. If I sit quietly and say nothing, how will Apple know that they have a problem? I still love OS X, and I’m not ready to switch to another OS yet, but I am pretty frustrated by what I perceive to be regressions in usability; an area where Apple normally excels.

UPDATE: I found a work around.

1. After bringing up the panel with ⌘T…
2. Click on the title bar of the Fonts panel, it will accept focus (with perceptible lag; strange).
3. From that point, click the currently selected font (this gives the Family column focus without changing the font).
4. Start typing and ignore the schizo-chang’o font circus going on in the background as you type.

UPDATE, UPDATE: This blog post has a horrible list to content ratio. Please forgive me.

Shortcomings in Dropbox’s response to losing user data

**Update:** Dropbox came through with a CSV containing the date, status, and full path to the file. Basically everything I asked for in the support request, and in just under 24 hours.

Dropbox recently discovered that their software lost user data. If you were affected, you probably received an email that started out like this:

> We’re reaching out to let you know about a Selective Sync issue that affected a small number of Dropbox users. Unfortunately, some of your files were deleted when the Dropbox desktop application was shut down or restarted while you were applying Selective Sync settings.

This sucks. It sucks for users, and it sucks for Dropbox. I know the gut wrenching cliff-dive of emotion that comes when you discover you’ve lost user data. I get it, but when you screw up like this, you have to go above and beyond in assisting recovery. Dropbox’s response hasn’t been horrible, but there’s more they can do to help users recover files.

I backup my data. I have a local [Time Machine backup](http://support.apple.com/kb/ht1427) that goes back about 18 months, and I use [Backblaze](https://www.backblaze.com) for remote backups. Dropbox indicates that the files were deleted about 7 months ago. Theoretically this means I should be able to recover any file that Dropbox lost.

Unfortunately, the format in which Dropbox provides lost file information makes recovery a very tedious process. In the notification email, Dropbox provides a link to their website where you can view details about the lost files. This is what the resulting page looks like:

review-notice

*Note: The black boxes are redaction intended to keep at least some semblance of privacy with regard to the information I’m sharing here.*

Let’s tally up our losses:

616 – 385 + 27 = 258
36 – 19 + 3 = 20
Total: 278

Knowing the damage, we must dive in to the next step: recovery. In order to recover a file, you need — at a minimum — the full name of the file that was lost. Ideally, you also know the full path to the file. Let’s see what details Dropbox has provided. Clicking the “385/616 files” link brings up this page:

lost-files-detail

A browsable interface. This helps me get oriented with what was lost, but I would very much prefer *not* to dig through a nested list of folders to identify almost three hundred lost files. In an effort to find a more comprehensive and machine parsable list, my eye was drawn to the “231 files” link. This is what I get:

lost-files-list

This is, frankly, a disaster. From the perspective of an IT person attempting recovery:

1. The filenames are incomplete (note the ellipses marked with red boxes).
2. There is no way to download this list.
3. There is no file path information provided.
4. The deletion date is a relative date.

Nearest I can tell, Dropbox has provided no means for IT staff to access a list of lost files that is useful for automated recovery. I submitted a support request to Dropbox, explaining much of the same information as I have posted here. If you were affected by the selective sync data loss issue, I’d appreciate it if you would send a similar request. The more requests they receive, the more likely we are to get something usable for mass-recovery.

>I recently received notification that a couple hundred of our files were lost due to a selective sync issue. What’s done is done. We build software too, so I understand how much this must suck for your team, but we’re working on recovery, and I think Dropbox can do more to help.
>
>We have backups of all our lost files, so I can perform a recovery, but the format Dropbox has provided information in isn’t usable by our IT department. A browsable format is nice for end-users, but from an IT recovery perspective, we could use the following in some machine parseable format (JSON, CSV, TSV, etc):
>
>* File name
>* Dropbox path to file
>* Status (un-recovered, restored, restored wrong version)
>* Date deleted (the actual date, not a human-friendly relative date)
>
>This list would benefit internal IT departments, as well as end-users who contact an IT support professional to assist with the recovery of lost files.
>
>Thanks,
>Brad

Easy HTTPS/SSL for development servers: WEBrick, lighttpd, Python SimpleHTTPServer, Pow, etc

If you’re developing web applications, you’ve no doubt noticed the common practice of including a development web server with your framework of choice. This is a convenience provided to allow developers to get going quickly with a framework, but the built-in tools are usually limited solutions. Unfortunately, you may run in to the limitations of the built-in web server, even when you’re just getting started.

One of the common shortcomings of these built-in web servers is a lack of SSL. Web servers like Nginx and Apache both provide easy to use SSL out of the box, but setting up these web servers to serve short-lived, ad hoc applications in varying frameworks is a bit too much overhead for my liking. Feeling that pain, I set out to find a simple way to proxy SSL requests to any web server.

The solution is an application called [stunnel](https://www.stunnel.org/). Stunnel is self-described as an SSL wrapper. With stunnel, you can create SSL tunnels defined by a simple configuration file. It was purpose built for the application I was seeking, and much, much more. Fortunately, it’s available through Homebrew:

brew install stunnel

The default install of stunnel from Homebrew contains only an example configuration, so you’ll need to add a live one:

cat << 'EOF' > /usr/local/etc/stunnel/stunnel.conf
pid = /tmp/stunnel.pid
setuid = nobody
setgid = nobody
foreground = yes
client = no
[https]
cert = /usr/local/etc/stunnel/stunnel.pem
accept = 443
connect = 4567
EOF

This config listens on port 443 (the standard SSL port), then attempts a connection on port 4567 (the default Sinatra port). You can (and should) change the connect port to whatever your development server requires.

The certificate specified is a self-signed certificate that is generated by the [Homebrew formula for stunnel](https://github.com/Homebrew/homebrew/blob/master/Library/Formula/stunnel.rb). The author’s name and details are used for the cert, but since I only use this for development, I don’t let it bother me.

With the config in place, you simply start stunnel from any bash prompt. Sudo is required because stunnel will listen on 443 (a privileged port). Keep in mind that if you already have a server listening on 443, you’ll encounter an error, so shut down any daemons listening on 443 before you do this.

sudo stunnel

Stunnel will stay running in your terminal, outputting log information, much like your application’s development server. If you invoke stunnel and you end up back at a bash prompt, you’ve encountered an error. Once stunnel is running, switch over to your application root and start your development web server.

With both running, you should be able to visit https://localhost/ and see your application. Note that because this configuration uses a self-signed certificate, your web browser will give you a security warning. You can dismiss this warning.

At the risk of sounding dumb, I’ll point out that you should NOT use the typical port for your application server when attempting to use an HTTPS connection. I initially requested https://localhost:4567/, which of course generated an error:

[2014-04-21 13:49:29] ERROR bad Request-Line `\x16\x03\x01\x00?\x01\x00\x00?\x03\x03SUZ)Bo?8}?ϯ?L??Gb???]\x0F\x7F.b’.
localhost – – [21/Apr/2014:13:49:29 EDT] “\x16\x03\x01\x00?\x01\x00\x00?\x03\x03SUZ)Bo?8}?ϯ?L??Gb???]\x0F\x7F.b” 400 351
[2014-04-21 13:49:29] ERROR bad URI `\x17??ne?M?????3?\x00\x00J\x00??$?#?’.

That’s what SSL encrypted traffic looks like to an out of the box WEBrick server, and obviously WEBrick doesn’t understand SSL… That’s what landed me here in the first place. If you see this, just drop the port specifier from your URL and try again. You should see console output in the terminal window where stunnel is running. If you don’t, check your stunnel configuration’s ‘listen’ directive to make sure it’s listening on the HTTPS default, 443.

How to prove that your car really is making that obnoxious noise

Our car has a feature called auto-hold. When turned on, you can bring the car to a stop, then take your foot off the brake and the car will keep the brake held for you until you press the accelerator. I really like this feature, but I’ve noticed that when I use it, I frequently hear a very high-pitch squeal from the driver’s side cabin. At first, I wasn’t sure if it was just my ears ringing, but I can reproduce it every time. Because the sound is so high-pitched, and because it’s relatively quiet, I wondered if there was a way that I could prove the sound was really there.

## The game plan

1. Record the sound with and without auto-hold (plus a baseline from a quiet room)
2. Perform spectrum (Fast Fourier Transform) analysis on the audio to examine the amplitude at different frequencies
3. Compare the spectrum plots from all three scenarios and look for anomalies

## Recording

Recording was easy enough. The iPhone has a Voice Memos application that can capture recordings of arbitrary length. I wasn’t sure if the built-in microphone had the range required to capture the noise, but I’d find out soon enough. I took 3 recordings of both scenarios:

* With auto-hold: Turn on auto-hold, bring the car to a stop, then record 10 seconds of audio
* Without auto-hold: Turn off auto-hold, bring the car to a stop, then record 10 seconds of audio

## Spectrum Analysis

With recordings in hand, it was time to have a look at a spectrum analysis. Spectrum analysis is something that blows your mind the first time you see it. The process uses some very fancy maths to break a signal (recording) apart in to a histogram of the various frequencies that make up the sound in the recording. The x-axis is frequency (pitch), and the y-axis is amplitude (volume). It’s important to note that amplitude is measured in decibels (dB). Decibels are not linear. They’re actually logarithmic. Keep that in mind when we get to the graphs.

The open source audio editing application, Audacity, has the ability to perform [FFT spectrum analysis](http://manual.audacityteam.org/o/man/plot_spectrum.html) using a variety of algorithms. I transferred the audio from my iPhone to my Mac using iTunes, tediously dragged the files out of iTunes and renamed them (grrrrr), then imported them in to Audacity. I had to discard one of my auto-hold recordings because I forgot to turn the stereo off (it was quiet, but still there). Duh! Fortunately, I made three recordings.

With the audio imported in to Audacity, I selected the audio for a single track, then clicked Analyze, Plot Spectrum. I used Hamming window for my FFT analysis, which is a good general-purpose windowing algorithm. The result for an auto-hold recording looked like this:

Audacity Spectrum Plot

While the spectrum plots in Audacity looked amazing, it’s not possible to compare more than one at a time. Fortunately, there’s an export button that gives us a tab-separted text file with all the computed values. Looks like a great job for GNUPlot.

## Comparison of Data

To compare the spectrum data, I exported the data to files: auto_hold.tsv, brake_hold.tsv, and ambient_room.tsv. I then used the following GNUPlot config to plot the graph:

# Let’s output to a jpeg file
set terminal jpeg size 810,600
# set terminal x11 size 810,600
# This sets the aspect ratio of the graph relative ot the size
set size 1, 1
# The file we’ll write to
set output “x3-autohold-spectrum-analysis.jpg”
# The graph title
set title “BMW X3 Audio Spectrum Analysis” font “Arial Bold,13”
# Where to place the legend/key
set key left top
# Draw gridlines both the x and the y axis
set grid y
set grid x
# Label the x-axis
set xlabel ‘Frequency Hz’
# Use a small font so we can fit more labels on the x axis
set xtics rotate by 40 offset -1,-1.15 font “Arial,9” autofreq 1000,1000
# Only plot from 50 Hz to 15,400 Hz
set xrange [50:15400]
# Label the y-axis
set ylabel “Amplitude (dB)”
# Tell gnuplot to use tabs as the delimiter instead of spaces (default)
set datafile separator ‘\t’
# Plot the data
plot “./auto_hold.tsv” every ::2 using 1:2 title ‘Auto-Hold’ with lines, \
“./brake_hold.tsv” every ::2 using 1:2 title ‘Brake-Hold’ with lines, \
“./ambient_room.tsv” every ::2 using 1:2 title ‘Quiet Room’ with lines

The result:

X3 Autohold Spectrum Analysis

The quiet room plot gives us a good baseline for the noise profile of the recording equipment. Obviously, I don’t have a proper quiet room, but this should allow us to make relative judgements. The dB values on the y-axis are relative attenuation. That’s a fancy way of saying, “the sounds at this frequency were Y dB less than the maximum possible sound level”. We have to look at audio from an attenuation standpoint, because there is no absolute loudness when it comes to audio recording. You have a ceiling, from which you can relate to everything else.

The culprit sticks out like a sore thumb. When using auto-hold, there is a massive spike between 14 kHz and 15 kHz. Knowing that 20,000 Hz is about the upper boundary of human hearing, this looks like it should represent the sound I’m hearing. The actual peak values from the data files are:

Auto-hold: 14814.843750, -65.007362
Brake-hold: 14814.843750, -76.494194

That’s over 10 dB difference at the peak when auto-hold is on, versus when it’s off. Keep in mind that decibels are logarithmic, so the sound is over 10 times louder when using auto-hold! What’s interesting is that there is still some production of sound in that frequency during normal operation. They’re just not loud enough for me to hear. The car really is making an obnoxious sound when using auto-hold!

The only remaining question is whether the service department will take this as evidence of my claim, or whether they’ll just go all glassy-eyed on me and walk away. Either way, this was a lot of fun.

Why the giraffe riddle is stupid, wrong, and I’m that annoying guy who corrects people’s jokes

A good riddle leaves you with an “ah ha” feeling after you learn the answer. Like a bad movie with lots of plot holes, a bad riddle leaves us unfulfilled. There’s a “giraffe riddle” circulating Facebook right now that is, well, bad. The riddle:

> “It’s 6:00 am, the doorbell rings and you wake up. You have unexpected visitors; it’s your parents, and they are there for breakfast. You have strawberry jam, honey, wine, bread and cheese. What is the first thing you open?” Remember, message me only! If you get it right I’ll post your name on my status, if you get it wrong you change your profile picture!

The purported answer is “your eyes”… Groan.

Ok, so what’s wrong with that answer? The problem is that the English language provides a means to express tense: past tense, present tense, and future tense.

Past: What is the first thing you opened?

Present: What are you opening?

Future: What is the first thing you [will] open? (the will is optional)

In the giraffe riddle, the first portion of the riddle sets the stage. We have the time, an event, and a description of your current circumstance. Then, we’re asked the question: What is the first thing you open?

So, according to the setup in the first portion of the riddle, we’re awake, the doorbell has rung, and we know it’s your parents who have arrived for breakfast. There is no mention that you have let them in, but it does mention you’re awake.

According to the responses I’ve received, the correct answer is “your eyes”, but that can’t be correct, because earlier in the riddle, it says we’re awake. The question “what is the first thing you open” implies future tense (or is at worst, ambiguous). Had the question been “what is the first thing you *opened*”, then your eyes would make sense as an answer.

The list of items is clearly intended to throw off the reader. It’s a clever setup, but the answer I’ve heard (your eyes) makes no sense unless the original author was a non-English speaker (some languages treat tense differently), or simply doesn’t understand grammar.

If you like the giraffe riddle (even if you don’t like the lousy answer), you might enjoy the riddle “A Giraffe, an Elephant, and a Refrigerator”:

> The following short quiz consists of 4 questions and will tell you whether you are qualified to be a professional. The questions are NOT that difficult.

> 1. How do you put a giraffe into a refrigerator?

> **Correct Answer:** Open the refrigerator, put in the giraffe, and close the door. This question tests whether you tend to do simple things in an overly complicated way.

> 2. How do you put an elephant into a refrigerator?

> Did you say, Open the refrigerator, put in the elephant, and close the refrigerator?

> Wrong Answer.

> **Correct Answer:** Open the refrigerator, take out the giraffe, put in the elephant and close the door. This tests your ability to think through the repercussions of your previous actions.

> 3. The Lion King is hosting an animal conference. All the animals attend…. except one. Which animal does not attend?

> **Correct Answer:** The Elephant. The elephant is in the refrigerator. You just put him in there. This tests your memory.

> Okay, even if you did not answer the first three questions correctly, you still have one more chance to show your true abilities.

> 4. There is a river you must cross but it is used by crocodiles, and you do not have a boat. How do you manage it?

> **Correct Answer:** You jump into the river and swim across. Have you not been listening? All the crocodiles are attending the Animal Meeting. This tests whether you learn quickly from your mistakes.

PS – I answered “the door”, and I’m not changing my profile picture :P

Apple’s greater vision of the post PC world

A friend of mine recently asked me how Apple expected to continue making any money while giving away software that Microsoft charges $200 for. Understanding how Apple can give away their software and still make money comes in understanding Apple’s business. Apple pundits frequently circle back to the point that Apple is a “hardware” company. As it turns out, they are wrong. Apple is a “devices” company. What is unique about Apple is their view that a device is made up of hardware & software, and that these two are inseparable. Apple believes this is the best view if you want to deliver a superior experience to the users of your products.

If you look at Apple as a hardware company — which I believe is a mistake — they make better margins than any of their competitors. Following that flawed line of thinking, what they’re doing now is using that extra profit to subsidize the software side. This viewpoint only holds if you view the hardware and software sides of the business as separate entities though.

Apple has combined the two. You’re not buying hardware or software, you’re buying a device. What good is a microwave without the software that connects the buttons to the timer, microwave generator, etc? That’s how Apple views their devices. By making Mavericks and iWork free, they’re expanding their notion of the “post PC world”. They’re not just talking about iOS devices, they’re talking about their entire line up.

If you’re wondering why Apple’s “PC” sales continue to grow while everyone else is sinking, I think you’ve found your answer.

Why you should never use “Identify with email”

I recently read an article advocating a method of [authentication using email](https://medium.com/p/d6509aa3c60b). My initial reaction was that the usability of such a solution would be very poor for a couple of reasons:

* It’s bad UX to have users jumping between applications/locations to accomplish a linear task.
* Email protocols don’t guarantee timely delivery; SMTP retry intervals are frequently specified in minutes, not seconds.

Besides the poor UX, there is a major security concern: email transport is unequivocally insecure.

With a shallow understanding of email, it appears that it *might* be secure, but that assumption would be wrong. The vast majority of email providers specify some form of encryption on the connection between client and server for both receiving (IMAP/POP) email, as well as sending (SMTP). However, this encryption is only used between you and your mail server because credentials are exchanged during these operations. Once the mail is handed off to your mail server, the email must be transported to the recipient mail server. This transfer to other servers is often unencrypted. As the auth provider, you could explicitly request encryption for SMTP relay to the destination server, but there is no guarantee that it will be accepted. What do you do when a user can’t receive secure email? Also, you have no way of knowing how the email will be relayed once you hand it off to the destination MX.

Authentication over HTTPS offers an explicit guarantee that A) the identity of the server is verified by a third-party, and B) the information being transported over the network cannot be read between here and there. Email cannot satisfy either of these important requirements, therefore you should avoid it as a primary means of authentication.

Apache Bench and Gnuplot: you’re probably doing it wrong

*Update: After some reflection and good feedback on [Hacker News](https://news.ycombinator.com/item?id=5557742), I should be clear that the graph output by the first method isn’t “wrong”, but rather (very) commonly misunderstood. I plan on doing a future blog post where I look at both graphs in more detail and try to find better ways to visualize the data.*

I should know. I’m a domain expert in “doing it wrong”. I’ve also seen this done in more than one place, so I’m going to memorialize my incompetence with Gnuplot in this blog post.

Does this invocation look familiar? This is a simple example of an Apache Bench command that will run a benchmark against the specified server.

ab -n 400 -c 10 -g apache-1.tsv “http://example.com”
^[1] ^[2] ^[3] ^[4] ^[5]

I’ll break it down.

1. `ab`: The Apache Bench benchmarking utility
2. `-n 400`: The number of requests for your benchmark (yes, this one is crazy small; it’s so people don’t hammer example.com by copy pasting)
3. `-c 10`: Number of concurrent requests
4. `-g apache-1.tsv`: This tells ab to write a “gnuplot-file” (that’s right from the man page)
5. `”http://example.com”`: The URL you want to benchmark against

If you’ve used Apache Bench much, you’ve probably discovered the `-g` switch already. The man page tempts you with the suggestion that “This file can easily be imported into packages like Gnuplot”. The words “easily” and “Gnuplot” should not be spoken in the same sentence. This is not because Gnuplot is a bad tool; it is that Gnuplot is so insanely powerful that few people understand how to use it. Up until this afternoon, I was misusing it as well.

You’ve probably generated a graph from your Apache Bench Gnuplot file that looks something like this:

Sequence plot

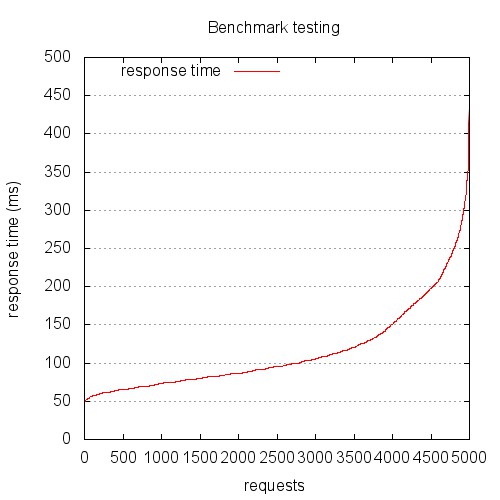
This is the graph you get if you treat the gnuplot file provided by Apache Bench as a log file. This graph is probably not showing what you think it does. Hint: this is not response (ms) over chronologically ordered requests.

The problem is, the file output by Apache Bench is not a log file, it’s a data file. Log files are (generally) written serially, so we can treat the sequence of the lines synonymously with time sequence. Let me stop here for a second and make this clear…

**The file output by the -g switch of Apache Bench is NOT in time sequence order. It is sorted by ttime (total time).**

Yikes. Yes, I am embarrassed that it has taken me this long to realize that, but I’m not alone, so here we are.

The other problem is that the common invocations of gnuplot found scattered around the Internet mistreat this file. Below is a very common example, but even this includes some elements that common scripts miss. The key to spotting the error is in the `plot` line. The sequence-based graph (above) was created using a Gnuplot script that looks like this:

# Let’s output to a jpeg file
set terminal jpeg size 500,500
# This sets the aspect ratio of the graph
set size 1, 1
# The file we’ll write to
set output “graphs/sequence.jpg”
# The graph title
set title “Benchmark testing”
# Where to place the legend/key
set key left top
# Draw gridlines oriented on the y axis
set grid y
# Label the x-axis
set xlabel ‘requests’
# Label the y-axis
set ylabel “response time (ms)”
# Tell gnuplot to use tabs as the delimiter instead of spaces (default)
set datafile separator ‘\t’
# Plot the data
plot “data/testing.tsv” every ::2 using 5 title ‘response time’ with lines
exit

Let’s look at the `plot` line in more detail:

plot “data/testing.tsv” every ::2 using 5 title ‘response time’ with lines
^[1] ^[2] ^[3] ^[4] ^[6] ^[7]

All of what I’m about to summarize is available in a much more detail in the gnuplot help pages, but here’s the tl;dr version:

1. `plot` draws a data series on the graphing area
2. This is the path to the input datafile
3. Think of `every` as in “take every X rows”, only a *lot* more powerful; in our case, `::2` means start at the second row
4. `using` allows you to specify which columns to use; we’ll use column 5, ttime (total time)
5. An explicit `title` for the series we’re plotting
6. Plot `with` lines

The problem is that we haven’t specified any x-axis ordering value. We’ve only specified that the values in column 5 should be used. Gnuplot will happily render our series for us.

The resulting graph has always puzzled me, and my bewilderment caused me to discard it and rely only on the data output by the Apache Bench report, rather than the graphs. If your graphs look anything like this, you’re looking at a request time distribution plot, with longer requests to the right, and shorter requests to the left. Hence the S-curve. It’s a fun graph, but it’s probably not telling you what you think it is.

Most people want to look at response (in ms) over time (seconds, serially). The good news is, everything we need is in the data file. Let’s look at a better Gnuplot script:

# Let’s output to a jpeg file
set terminal jpeg size 500,500
# This sets the aspect ratio of the graph
set size 1, 1
# The file we’ll write to
set output “graphs/timeseries.jpg”
# The graph title
set title “Benchmark testing”
# Where to place the legend/key
set key left top
# Draw gridlines oriented on the y axis
set grid y
# Specify that the x-series data is time data
set xdata time
# Specify the *input* format of the time data
set timefmt “%s”
# Specify the *output* format for the x-axis tick labels
set format x “%S”
# Label the x-axis
set xlabel ‘seconds’
# Label the y-axis
set ylabel “response time (ms)”
# Tell gnuplot to use tabs as the delimiter instead of spaces (default)
set datafile separator ‘\t’
# Plot the data
plot “data/testing.tsv” every ::2 using 2:5 title ‘response time’ with points
exit

We’ll look at the plot line in more detail:

plot “data/testing.tsv” every ::2 using 2:5 title ‘response time’ with points
^[1] ^[2] ^[3] ^[4] ^[5] ^[6]

I’m going to repeat myself some here, but I want this to be clear, so here we go.

1. `plot` draws a data series on the graphing area
2. This is the path to the input datafile
3. Think of `every` as in “take every X rows”, only a *lot* more powerful; in our case, `::2` means start at the second row
4. `using` allows you to specify which columns to use; we’ll use columns 2 and 5, seconds (unix timestamp) and ttime (total time)
5. An explicit `title` for the series we’re plotting
6. Plot `with` points (lines won’t work, as we’ll see below)

The resulting graph looks like this:

Time series plot

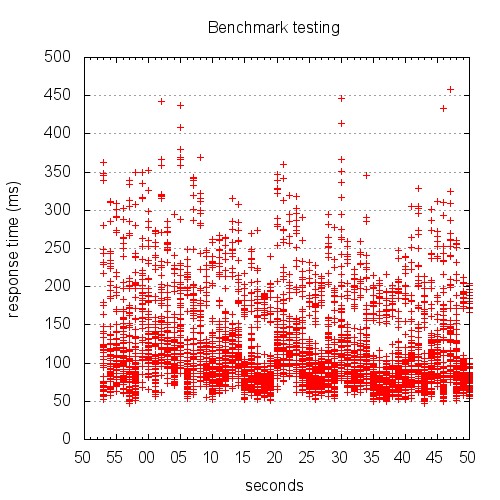
Yeah, I know. Right now, you’re scratching your head trying to figure out just what the hell you’re looking at. This is not the pretty line graph we thought we were going to get.

Here’s the thing: unless you’re testing something unrealistically simplistic, your response times aren’t going to be well represented by a single line at any given time.

Keep in mind a few things:

* We told Apache Bench to use concurrency 10
* Apache Bench is going to go all out
* The granularity of our time data is 1 second

The result is a graph that shows stacks of points. The graph above is difficult to read, because it’s rendered in such a small area. The version below is rendered at 1280 x 720. Give it a click to view the large version.

timeseries-1280x720

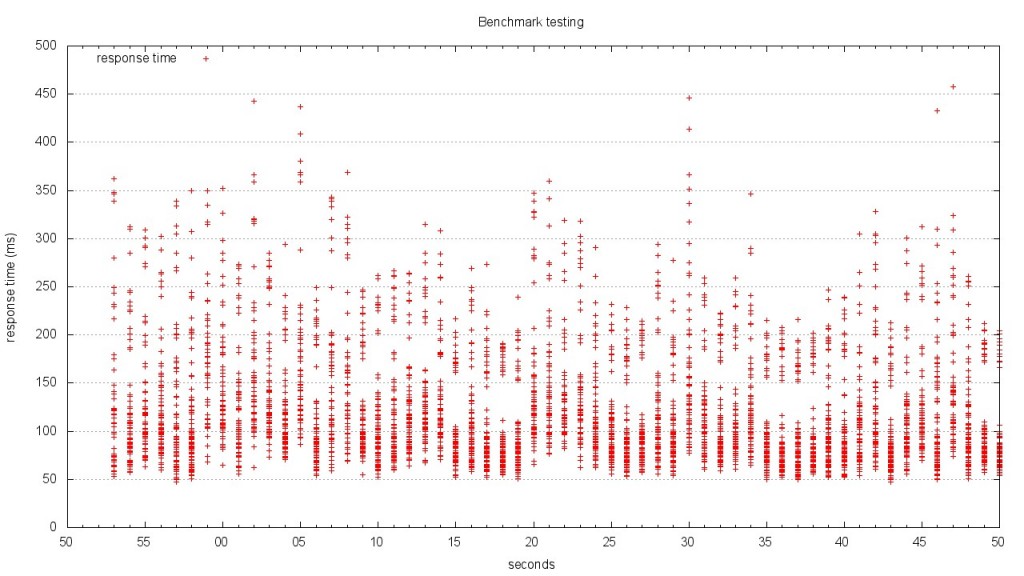
When you look at this graph, it becomes much clearer what’s going on. At each second of the test, there is a distribution of response times. The benchmark results I plotted are from one of the most complex JSON endpoints in our application. I also turned off caching so that the result would be computed each time. This made the data complex, but isn’t that what we’re after? If we can’t infer meaning from complex data, what good are our tools? Looking at this graph, I can see the distribution of response times, as well as the upper and low boundaries.

The scatterplot style graph is what I plan on using for now, but I think a candlestick chart or heatmap would probably be the best representation. I’m going to continue to work on the Gnuplot script until I have something really refined, so keep an eye out for updates!

[Comments welcome on Hacker News](https://news.ycombinator.com/item?id=5557742)